Introduction To Graph In Data Structure
Graphs are strong data structures that describe real-world entity relationships. From social networks to Google maps and the internet to blockchains and neural networks, graphs are everywhere. They are employed in a range of practical difficulties because of their ability to provide abstractions to real-life situations. We’ll look at what graphs are in terms of graph in data structure, their kinds, terminology, operations, representation, and applications in this blog on Graph in data structures.
Non-linear data structures, such as graph in data structures, are made up of a finite number of nodes or vertices and the edges that connect them. Graphs are employed in data structures to solve real-world problems by representing the problem area as a network, such as telephone networks, circuit networks, and social networks. In a telephone network, for example, it can represent a single user as nodes or vertices, while the relationship between them via telephone represents edges.
What Is Data Structure
A data structure is a type of storage that is used to organize and store data. It is a method of organizing data on a computer so that it may be easily accessible and modified. It’s critical to choose the correct data format for your project based on your requirements and project. If you wish to store data sequentially in memory, for example, you can use the Array data structure.

The Data Structures (DS) tutorial covers both fundamental and sophisticated data structure topics. Our Data Structure course is suitable for both beginners and experts. Data structure is a method of storing and organizing data in order to make it more useful. Our Data Structure tutorial covers Arrays, Pointers, Structures, Linked Lists, Stacks, Queues, Graphs, Searching, Sorting, and Programs, among other topics.
The name of the data structure implies that it is used to organize data in memory. As we’ve already seen with one of the data structures, the array in C, there are numerous ways to organize data in memory. A collection of memory components in which data is stored consecutively, i.e. one after the other, is known as an array. To put it another way, an array stores elements in a continuous manner. This data organization is accomplished through the use of a variety of data structures. There are several additional methods for remembering info. Let’s look at the various forms of data structures. To explore more about graphs click here.
The data structure is not written in any programming language, such as C, C++, or Java. It is a set of methods that may be used to structure data in memory in any programming language. A number of strategies have been developed to structure data in memory, and all of these algorithms are known as Abstract data types. The set of rules is made up of these abstract data kinds.
Graph In Data Structure
You will discover what a Graph in Data Structure is in this blog. You will also discover graph representations. A graph in data structure is made up of nodes with data and connections to other nodes. Let’s look at an example to see how this works. Everything on Facebook is a node. A node is anything that has data, such as a user, a photo, an album, an event, a group, a page, a comment, a story, a video, a link, or a note.
Every connection is a path from one node to the next. Whether you share a photo, join a group, like a page, or anything else, you’re giving that relationship a new edge.
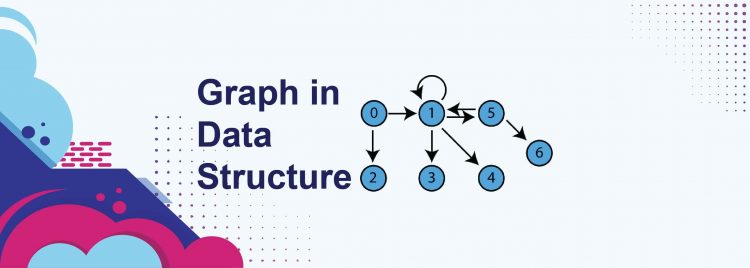
Let’s look at what a graph in a data structure is. Graphs are non-linear data structures made up of nodes (or vertices) that are connected by edges (or arcs). Edges express the relationships between nodes, which are entities where data is kept. There are two types of edges: directed and undirected. The graph in data structures makes complex relationships simple to understand and may be utilized to solve a variety of real-world problems.

Facebook, for example, employs a graph in data structure, which consists of a collection of items and their connections. Every person, photo, post, page, location, and other items with data on Facebook is represented as a node. Every edge connecting two nodes indicates their connections, friendships, ownerships, tags, and so on. A new edge is formed for that relationship whenever a user submits a photo, comments on a post, or does anything else. Meta-data is associated with both nodes and edges.
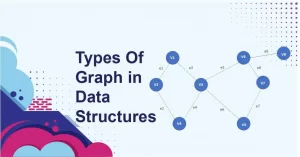
Types Of Graph in Data Structures
- Adjacency: If there is an edge linking two vertices, they are said to be adjacent. Because there is no edge connecting vertices 2 and 3, they are not neighboring.
- Path: A path is a collection of edges that allows you to travel from vertex A to vertex B. Paths from vertex 0 to vertex 2 are 0-1, 1-2, and 0-2 respectively.
- Directed Graph: A directed graph in data structure is one in which an edge (u,v) does not always imply the presence of an edge (v, u). The edges of such a graph are represented by arrows that indicate the edge’s orientation.
- Undirected Graph: An undirected graph in data structure is made up of a collection of nodes and the links that connect them. The sequence in which the two connected vertices are connected is immaterial and has no bearing. With a finite number of vertices and edges, you can create an undirected graph.
- Complete Graph: A complete graph in data structure is one in which all nodes are connected to each other. The number of edges in a complete graph is n(n-1)/2, where n is the number of nodes in the graph.
- Connected Graph: A linked graph in data structure is one in which every two vertices (u, v) in V have a path connecting them. In a connected network, there are no solitary nodes.
- Weighted Graph: Each edge in a weighted graph in data structure is given a value, such as a length or weight. The cost of crossing an edge e can be expressed as w(e), which must be a positive(+) value. Because each edge includes a value or weight representing the cost of traveling that edge, a graph G= (V, E) is called a labeled or weighted graph.
- Digraph: A digraph is a directed graph in data structure in which each graph edge is associated with a certain direction and traversing is only possible in that direction.
- Degree of the Node: The number of edges connecting to a node is the degree of that node. An isolated node refers to a node with a degree of zero.
Algorithm for Traversing Graphs
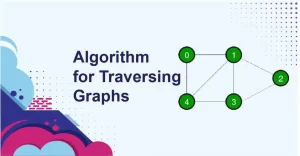
Graph traversal is the process of visiting or updating each vertex in a graph. Such traversals are classified based on the order in which they traverse the vertices. A subset of tree traversal is graph traversal.
A graph traversal algorithm can be implemented using one of two methods:

- Breadth-first search
- Depth-first search
1. Breadth-First Search or BFS
BFS is a me
thod of searching for a node in a graph in data structure that meets a set of criteria.
- It starts at the top of the graph and explores all nodes at the current depth level before going on to the next depth level.
- More memory and, in general, a queue are required to keep track of the child nodes that have been encountered but not yet inspected.
Algorithm of breadth-first search
Step 1: Think about the graph you’d like to navigate.
Step 2: Choose any vertex in your graph, such as v1, from which you’d like to traverse it.
Step 3: Look at any two data structures that could be used to traverse the graph.
- Visited array (size of the graph)
- Data structure of a queue
Step 4: You’ll start with the vertex and add it to the visited array, then add v1’s adjacent vertices to the queue data structure.
Step 5: Using the FIFO principle, remove the element from the queue, place it in the visited array, and then return to the queue to add the removed element’s adjacent vertices.
Step 6: Repeat steps 5 and 6 until the queue is not empty and there are no more vertices to visit.
2. Depth-First Search or DFS
DFS is a method of searching for a node in a graph in data structure that meets a set of criteria.
- Data structures like trees and graphs are traversed or explored using the depth-first search (DFS) technique. Before backtracking, the DFS algorithm starts at the root node and investigates each branch as far as possible.
- More memory, usually a stack, is necessary to keep track of the child nodes that have been encountered but not yet inspected.
Depth-first search algorithm
Step 1: Think about the graph you’d like to navigate.
Step 2: Choose any vertex in our graph, such as v1, from which you’d like to start traversing it.
Step 3: Look at any two data structures that could be used to traverse the graph.
- Visited array (size of the graph)
- Stack data structure
Step 4: Push all the neighboring nodes or vertices of vertex v1 into the stack and insert v1 into the array’s first block.
Step 5: Now, using the FIFO principle, pop the topmost element and push all of the popped element’s adjacent nodes into the visited array.
Step 6: If the stack’s topmost element is already in the array, reject it instead of placing it into the visited array.
Step 7: Keep repeating steps 6 and 7 until the stack data structure is not empty.
Operations on Graph in Data Structure
The basic graph operations in data structure are as follows:
- Add/Remove Vertex — In a graph, add or remove a vertex.
- Add/Remove Edge — You can add or remove an edge between two vertices with this command.
- Examine the graph for the presence of a specific value.
- Determine the path from one vertex to the next.
Graph Representation
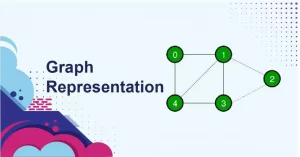
In data structures, graph in data structures is used to represent object relationships. Every graph is made up of a set of vertices or nodes that are connected by lines called edges. In a network, the vertices represent entities. The following are the two most common graph representations:
- Adjacency matrix
- Adjacency list
You’ll learn more about these two graph representations in data structures. These are two popular ways to represent graph in data structures:
1. Adjacency Matrix
A 2D array of V x V vertices is called an adjacency matrix. A vertex is represented by each row and column. If any of the elements a[i][j] has a value of 1, it means that an edge exists between vertex I and vertex j.
- An adjacency matrix is a sequential representation.
- It’s used to indicate which nodes are near to each other. Is there any link between the nodes in a graph?
- For this representation, you generate an MXM matrix G. If there is an edge between vertex a and vertex b, the corresponding element of G, gi,j, equals 1; otherwise, gi,j equals 0.
- Instead of 1s and 0s, you can record the edge’s weight if the graph is weighted.
The adjacency matrix for the graph in data structure we created above is
(MODIFY THIS IMAGE)
Because this is an undirected graph, we must also mark edge (2,0) in order to make the adjacency matrix symmetric about the diagonal.
In adjacency matrix representation, edge lookup (checking if an edge exists between vertex A and vertex B) is extremely quick, but we must reserve space for every conceivable link between all vertices(V x V), therefore it takes up more space.
2. Adjacency List
An adjacency list is an array of linked lists that depicts a graph. Each entry in the array’s linked list represents the other vertices that form an edge with the vertex, and the index of the array indicates a vertex.
- An adjacency list is a linked representation.
- In this approach, you store a list of neighbors for each vertex in the graph. It means that each vertex in the graph has a list of the vertices that are adjacent to it.
- The matching array member for each vertex x points to a singly linked list of x’s neighbors. You have an array of vertices indexed by the vertex number.
The following is the adjacency list for the graph we created in the first example:
(MODIFY THIS IMAGE)
Because we only need to keep the values for the edges, an adjacency list is efficient in terms of storage. This can save a lot of space in a graph with millions of vertices.
After you’ve grasped the representation of a graph in data structure, you’ll be able to see which operations are carried out in the graph in data structure.
Terminologies Of Graph in Data Structures
The essential terminologies of Graph in data structures are as follows:
- One of the two fundamental items used to build graph in data structure is an edge. Each edge has two vertices to which it is joined at both ends.
- Two vertices are adjacent if they are ends of the same edge.
- Outgoing edges of a vertex are directed edges that point to the origin.
- The incoming edges of a vertex are directed edges pointing to the vertex’s destination.
- The degree of a vertex in a graph is the total number of edges that occur to it.
- The entire number of outgoing edges is the out-degree of a vertex in a directed graph, and the total number of receiving edges is the in-degree.
- A source vertex is one with an in-degree of zero, while a sink vertex has an out-degree of zero.
- A zero-degree vertex that is not an edge’s endpoint is called an isolated vertex.
- A path is made up of a series of alternating vertices and edges, each of which is connected by an edge.
- A cycle is defined as a path that starts and ends at the same vertex.
- A simple path is one that has just unique vertices.
- A graph is strongly linked if it contains a directed path from x to y and a directed path from y to x for each pair of vertices x, y.
- If all of the directed edges in a directed graph are replaced with undirected edges, the result is a connected graph. The vertices of a weakly linked graph have at least one out-degree or in-degree.
- A connected forest is a tree. A rooted tree, often known as a free tree, is the most basic form of the tree.
- A spanning tree is a spanning subgraph that is also a tree.
- The most connected subgraph of an unconnected graph in data structure is called a connected component.
- The graph would be severed by a bridge, which is a removal edge.
- Forest is a graph in data structure that does not have a cycle.
Applications Of Graphs in Data Structures
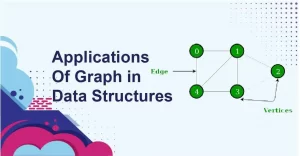
The following are some examples of graph applications in data structures:
- In computer science, graph in data structure is used to depict the flow of computation.
- On Facebook, users are referred to as vertices, and there is an edge linking them if they are friends. Graph theory is used to power Facebook’s Friend Suggestion mechanism.
- In the Operating System, you’ll come across the Resource Allocation Graph, which lists each process and resource vertically. From resources to assigned functions, or from the asking process to the desired resource, edges are drawn. If this results in the development of a cycle, a stalemate will occur.
- On the World Wide Web, web pages are referred to as vertices. Assume that a connection from page A to page B can be used to represent an edge. A directed graph is depicted in this application.
- Graph transformation systems use rules to manipulate graphs in memory. Graph databases are permanent databases that store and query graph-structured data in a transaction-safe way.
Finally, you’ll look at the code for Graph in data structures in this blog.
Conclusion
In this “Graph in data structures” blog, you learned what a graph data structure is and the many forms of graph in data structures. The graph traversal approach, which incorporates the breadth-first and depth-first search algorithms, as well as another graph in data structure applications, was then introduced.
Knowing how to use Graph in data structures will help you better understand programming ideas and ace your coding interview. We hope that this article has provided you with a thorough grasp of what a graph is in a data structure, its terminology, types, graph operations in a data structure, representation, and applications.
Please feel free to ask any questions you may have about the “Graph in data structures” article in the comments area below. We will gladly assist you in resolving your issues as quickly as possible. Until then, keep an eye on DataTrained’s channel and continue to study.
Frequently Asked Questions
What is graph in data structure?
A graph in data structure made up of nodes and edges that is non-linear. The edges are lines or arcs that connect any two nodes in the graph in data structures, and the nodes are also known as vertices.
What is graph in data structure and types in data structure?
Directed Graph, Non-directed Graph, Null Graph, Simple Graph, Trivial Graph, Complete Graph, Cycle Graph, Cyclic Graph, Acyclic Graph, Connected Graph, Disconnected Graph, Regular Graph, Finite Graph, Infinite Graph, Pseudo Graph, Bipartite Graph, Planar Graph, Multi Graph, and Euler Graph are the various types of graphs based
What is graph in data structure and example?
A diagram depicting the relationship between quantities, particularly one in which lines, bars, or proportional areas depict how one quantity is affected by or altered by another. Information presented in a graphic way. Take a look at some business graphics.
A diagram depicting many types of quantitative information and relationships, such as the successive changes in a variable quantity or quantities, as a curve, broken line, or sequence of bars.
What is graph in data structure in simple words?
a figure (e.g., a series of one or more points, lines, line segments, curves, or regions) that depicts the variation of one or more variables in relation to one or more other variables. All points whose coordinates meet a certain relation are collected in this collection (such as a function).
What is graph in data structure and its application?
The flow of computing is defined using graph in data structures. Graphs are used to represent communication networks. Data organization is shown using graphs. Graph transformation systems manipulate graphs in memory using rules.
What graphs are best for what data?
In our blog of what is graph in data structure. Statistical summaries are useful for determining the frequency of an event, whereas column histograms are useful for determining the frequency of an occurrence. Scatter plots are the most effective way to visualize dispersion in huge data sets.
How are graphs useful when interpreting data?
They make it easier to spot patterns in the data. They’re less difficult to make than data tables. They can be used to display extra information. Because they display information quickly and readily, graphs are great visual aids. Graphs in statistics depict the relationship between variables or the range of values for a given variable or phenomenon.
Where are graphs used in real life?
In our blog of what is graph in data structure, other graph in data structures can be found in science, engineering, and everyday life, such as the links between atoms in molecules and crystal grids. A network can be used to model the transmission of diseases and epidemics. The evolutionary trees that indicate a species’ ancestry create a graph in biology.
What are the 3 main types of graphs?
In our blog of what is graph in data structure lets discuss 3 main types of graphs
- Line Graphs
Line graphs, like the ones we’ve seen so far, demonstrate a relationship between two variables: one measured on the horizontal axis and the other measured on the vertical axis. It’s sometimes advantageous to display multiple sets of data on the same axes.
- Pie Graphs
A pie graph (also known as a pie chart) is a visual representation of how a total is divided into sections. A circle depicts the entire group. The relative sizes of subgroups are represented by the slices of this circular “pie.”
- Bar Graphs
The height of different bars in a bar graph is used to compare quantities.
In a graph, a quadrant is the area enclosed by the x and y axes; thus, there are four quadrants. To explain, the x and y axes divide the two-dimensional Cartesian plane into four quadrants. Quadrant I is at the upper right corner, while Quadrants II through IV are in a counterclockwise manner.